
The Washington Business Journal published its 2026 ranking of Greater Washington’s wealthiest ZIP codes on August 20, and three of ours made the list of 54. North Reston’s 20194 came in at No. 24. Herndon’s 20171 landed at No. 34. Reston Town Center’s 20190 followed at No. 35.
The 20194 result carries the most weight. Fairfax County placed four ZIP codes in the region’s top 25, and North Reston is one of them, sitting alongside Dunn Loring at No. 18, McLean’s 22101 at No. 21, and Vienna’s 22180 at No. 23.
Look further down the list and the result gets stranger. North Reston finished 14 places above Potomac, 15 above Oakton, 16 above McLean’s other ZIP code, and 17 above Great Falls.
Great Falls reports a per-capita income 20 percent higher than North Reston’s. Its median home value runs 58 percent higher, $1,310,200 against $827,100. It still ranks 17 spots lower.
The methodology explains the gap, and once you see it, a lot of what Bob Simon built in 1964 shows up in the numbers.
What the ranking actually counts
The Business Journals runs the national version of this list under the name the Wealthy 1000. Its formula weighs income, home equity, estimated savings, poverty rates, educational attainment, and population density, and it screens out ZIP codes below $70,000 in per-capita income so that crowded low-income areas do not slip in on density alone.
The Washington Business Journal describes the goal plainly in this year’s write-up: the analysis factors in population density to show “where the most wealth is concentrated, not just where the richest people live,” and to identify which areas “collectively, have the most buying power.”
Concentration is a ratio, and every ratio has a denominator. Here the denominator is land. A ZIP code that spreads 17,000 residents across 25 square miles of two-acre lots produces a thinner concentration than one that stacks 12,000 residents onto three square miles, even when the first group earns more per person.
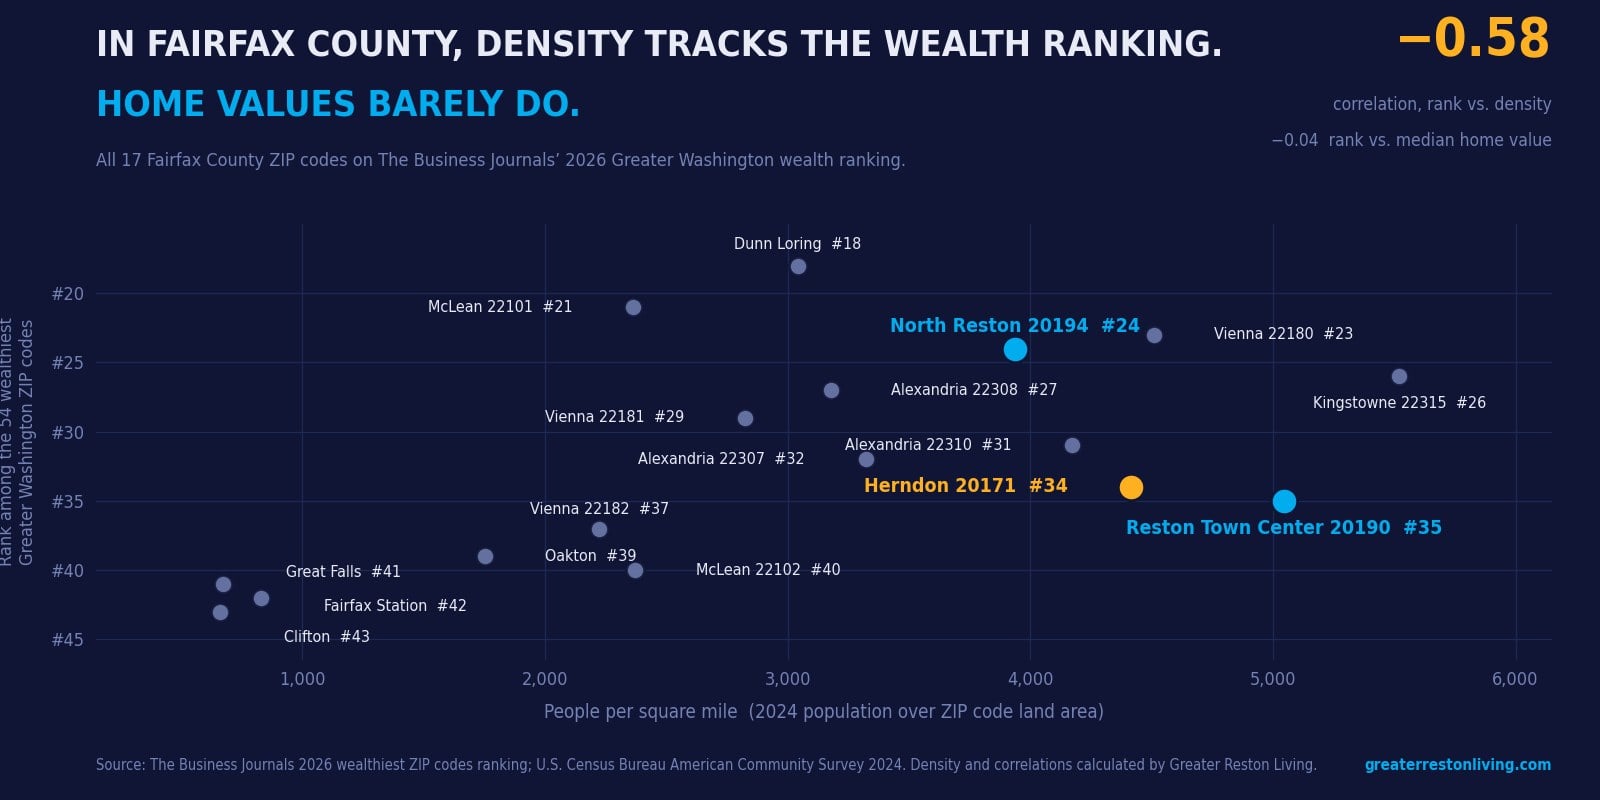
Run the arithmetic on all 17 Fairfax County ZIP codes that made the list and the pattern holds up. Rank correlates with population density at −0.58, a fairly strong relationship for social data. Rank correlates with median home value at −0.04, which is close to no relationship at all.
Reston was designed to score this way
Robert E. Simon Jr. bought 6,750 acres of Sunset Hills Farm in 1961 with proceeds from his family’s sale of Carnegie Hall, and the plan he commissioned made a specific bet about land. Rather than spreading houses evenly across the acreage, Reston’s planners grouped homes tightly and banked the leftover ground as shared open space. The National Register nomination for the Lake Anne Village Center Historic District quotes the original framing: “The cluster housing technique will make possible additional open space and access to parks or ‘commons’ as an integral part of the neighborhood life.”
Simon described the reasoning himself in the Reston Association cluster handbook. Grouping roughly 100 families together, he wrote, meant those neighbors “would get to know each other sooner and better than if there were no such association.”
Sixty-two years after Reston opened in 1964, Reston Association maintains more than 1,300 acres of common open space, 55 miles of paved pathways and natural-surface trails, four lakes covering more than 125 acres, and 15 outdoor pools, all serving more than 60,000 people across 22,000-plus residential units. None of that land sits under a house. All of it sits inside the ZIP code boundaries that the ranking divides by.
Set the two places side by side and the design decision shows up as a number.
| North Reston 20194 | Great Falls 22066 | |
|---|---|---|
| Regional wealth rank | No. 24 | No. 41 |
| Per capita income | $105,788 | $127,424 |
| Median home value | $827,100 | $1,310,200 |
| Population | 12,275 | 17,185 |
| Land area | 3.12 sq. miles | 25.58 sq. miles |
| People per square mile | 3,937 | 672 |
| Owner-occupied units | 70.1% | 92.8% |
| Poverty rate | 3.3% | 2.0% |
Great Falls covers eight times the ground. North Reston concentrates roughly 4.9 times as much annual income into each square mile, about $417 million against $86 million. The ranking rewards the second number.
Reston Town Center holds the cheapest homes on the list and the densest income
The 20190 result runs in an odd direction. Its median home value of $581,400 is the lowest of any of the 54 ZIP codes on the entire Greater Washington list, below every ZIP code in the District, Arlington, Bethesda and Alexandria. Only 45 percent of its housing units belong to owners.
That same ZIP code concentrates more annual income per square mile than any other Fairfax County entry on the list, roughly $436 million.
The explanation is stacked construction. ZIP code 20190 holds Reston Town Center, Reston Station, Lake Anne Plaza and Isaac Newton Square, and it packs 12,036 housing units and 22,012 people onto 4.36 square miles. High-rise condos and apartments pull the median value down because a one-bedroom unit is not a five-bedroom colonial. They pull income density up because a single tower holds what a cul-de-sac spreads across forty lots.
For anyone pricing a home in 20190, the $581,400 figure deserves a caveat before it travels any further. That number is a Census estimate of what owners say their homes are worth, blended across a housing stock that runs from studio condos to Lake Anne single-family houses. It is not a sale price, and it is not a comparable.
Herndon 20171 is not the Town of Herndon
Herndon’s 20171 placed 34th, and it is the most populous Fairfax County ZIP code on the entire list at 51,286 residents. Across all 54 ranked ZIP codes in the region, only Ashburn’s 20148 holds more people.
The name on the mail does not track the jurisdiction line here. ZIP code 20171 carries a Herndon mailing address, but almost none of it sits inside the incorporated town. Census geocoding of addresses across 20171 returns Franklin Farm, Floris, McNair and Sully Square, all unincorporated census-designated places in Fairfax County. Oak Hill Elementary, Fox Mill Elementary and Floris Elementary all carry Herndon 20171 addresses and all sit outside town limits.
The incorporated Town of Herndon covers 4.29 square miles and holds about 25,500 residents, and its ZIP code, 20170, did not make the region’s list of 54.
The Silver Line makes the same point in physical form. The station named Herndon sits at the Herndon-Monroe Park & Ride on Sunrise Valley Drive, which carries a 20191 address inside the Reston census-designated place, outside the town it is named for. The Innovation Center station, one stop west, is the one that actually sits in 20171.
This matters for anyone shopping by school pyramid or by tax bill. A Herndon mailing address tells you almost nothing about whether you will pay the town’s real estate tax rate on top of Fairfax County’s, or which town services you can vote on.
Where the three local ZIP codes landed
| ZIP | What it covers | Rank | Per capita income | Median home value | Owner-occupied | People per sq. mi. |
|---|---|---|---|---|---|---|
| 20194 | North Point, Lake Newport, north Reston | No. 24 | $105,788 | $827,100 | 70.1% | 3,937 |
| 20171 | Oak Hill, Franklin Farm, Floris, McNair | No. 34 | $77,217 | $797,200 | 54.7% | 4,415 |
| 20190 | Reston Town Center, Reston Station, Lake Anne | No. 35 | $86,420 | $581,400 | 45.0% | 5,045 |
Together those three ZIP codes hold 85,573 people and 37,550 housing units.
Two local ZIP codes did not appear anywhere on the 54: 20191, covering South Reston, Hunters Woods, South Lakes, Lake Thoreau and Lake Audubon; and 20170, the Town of Herndon. Their absence sets a floor rather than a verdict. Every ZIP code on the list clears $70,000 in per-capita income, and the lowest per-capita income among the 54, Haymarket’s 20169, comes in at $75,450. Missing the cut in a 54-code regional ranking says a ZIP code fell short on a blended score, and nothing more.
The data is two years old, and 2025 is missing from it
The demographics behind the ranking come from the Census Bureau’s 2024 American Community Survey. That vintage carries two consequences worth holding onto.
Federal workforce reductions landed mostly in 2025, so this ranking cannot see them. The Washington Business Journal makes that caveat itself and notes that the District has absorbed the sharpest effect. Bureau of Labor Statistics figures for June 2026 put the District’s unemployment rate at 6.0 percent, the highest of any state or district in the country, against 3.7 percent in Virginia.
The median home values are also survey estimates, not transaction data. The Census asks owners what they believe their home would sell for. Those answers lag actual closings, and they blend property types that share nothing but a ZIP code. As a benchmark for a North Point colonial in 2026, $827,100 is the wrong instrument.
The regional backdrop: money moving outward, and money moving away
Two larger patterns sit underneath this year’s shuffle.
The first is what economists call the donut effect. Arjun Ramani and Nicholas Bloom of Stanford wrote a 2021 policy brief for the Stanford Institute for Economic Policy Research reporting that central business districts and the densest tenth of ZIP codes saw rents drop more than 10 percent as demand moved outward toward more space. Their NBER working paper 28876 puts rent growth in the central business districts of the 12 largest U.S. metros about 15 percentage points behind the least dense half of ZIP codes.
The Business Journals’ own numbers show the same drift locally. Twelve of last year’s 25 wealthiest regional ZIP codes sat inside the District. This year six do, while Arlington also holds six, Montgomery County five, Fairfax County four, Alexandria three and Falls Church one.
The second pattern points out of the region entirely. The Washington Business Journal reports, citing work by Dennis Jansen and Somali Ghosh Sinha at Texas A&M’s Private Enterprise Research Center, that $23.2 billion in adjusted gross income flowed out of Greater Washington against $19.9 billion flowing in, a net loss of $3.3 billion. The same reporting notes that Greater Washington placed 48 ZIP codes among the nation’s 1,000 wealthiest last year and 28 this year.
Both patterns favor the close-in suburbs over downtown, and both favor Northern Virginia over the District. Reston and Herndon sit in the part of the map that gains from the first pattern and holds reasonably steady against the second.
What this means if you own a home here, or want to
A ranking is not a valuation. The wealth ranking measures the concentration of income, equity and buying power inside a boundary. It does not price your house. The methodology that lifted 20194 above Great Falls would do the same thing if every home in both places lost value tomorrow, as long as the land areas stayed put.
Density is what the ranking rewards, and Reston has it by design. The townhouse lots and the shared open space come from the same plan that put village centers, restaurants and two Silver Line stations within walking distance of housing. The Wealthy 1000 formula scores that arrangement well. Reston’s planners chose it for reasons that had nothing to do with a ranking.
The 20190 number needs interpreting before anyone acts on it. A median home value of $581,400 in Reston Town Center reflects a condo-heavy inventory, not a discount on comparable houses. Pricing a Lake Anne single-family home or a Town Center penthouse off that median produces bad decisions in both directions.
Check the jurisdiction before you fall for the mailing address. If you are shopping a Herndon-addressed home in 20171, confirm whether it sits inside town limits. Town residents pay a separate town real estate tax, vote in town elections, and receive town services. The 20170 and 20171 boundary lines do not follow the town line.
Watch the 2025 data when it arrives. Next year’s ranking will incorporate the federal employment changes of 2025 for the first time. Reston and Herndon carry a heavy technology and federal-contracting employment base, so the next release will say more about this market than this one does.
The short version
North Reston’s 20194 ranks 24th among the region’s wealthiest ZIP codes and stands as one of four Fairfax County entries in the top 25. Herndon’s 20171 and Reston Town Center’s 20190 follow at No. 34 and No. 35. Reston places above larger-lot, higher-priced communities because the ranking measures wealth per square mile, and because a plan drawn in the early 1960s deliberately traded private acreage for shared open space and denser village cores. The underlying figures date from 2024 and describe concentration, not price. Read them that way and they hold up. Use them to price a house and they will lead you astray.
If you want to know what your specific home is worth in the Reston or Herndon market right now, that takes current sales data, not a ranking built on a two-year-old survey. We run those numbers for clients every week, and we are happy to run them for you.