

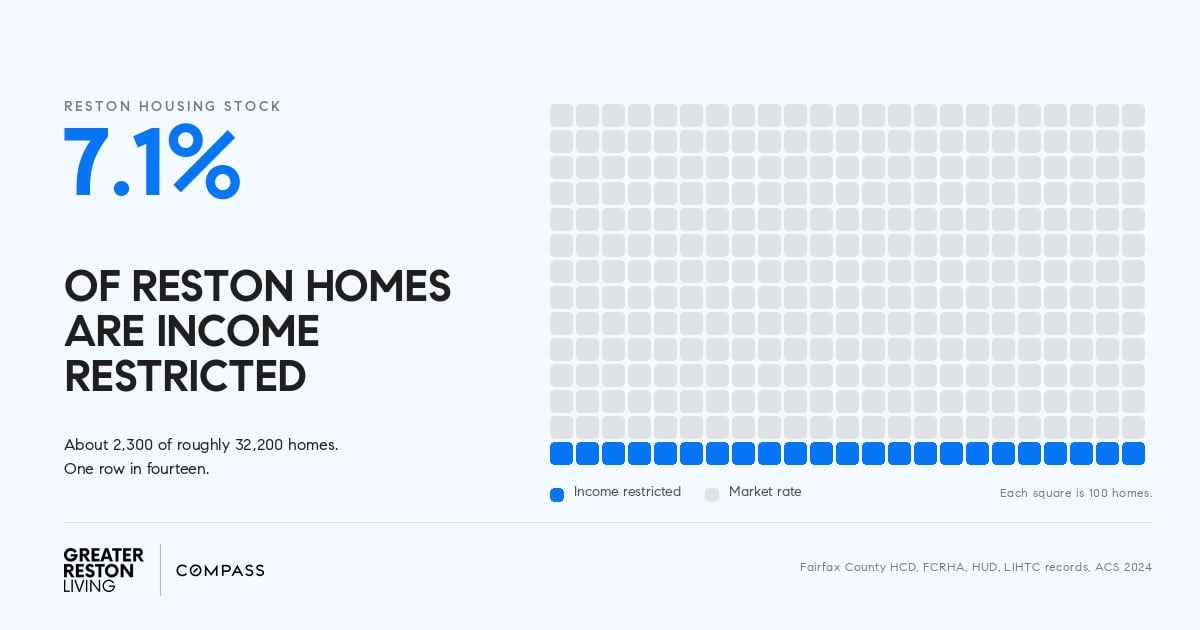
Fairfax County publishes a great deal of housing data. It does not publish this one number: the share of Reston’s homes that carry a legal affordability restriction.
The county tracks affordable units by program and by project. Reston is not a city, so no agency reports a Reston total. We built one property by property, from the Fairfax County Rental Program roster, the FCRHA asset management budget, the county’s privately owned affordable rental list, HUD and Low-Income Housing Tax Credit records, rezoning proffers, and reporting on individual buildings.
The short answer: about 7 percent
Roughly 2,300 deed-restricted homes sit inside a Reston housing stock of about 32,200 units. That works out to 7.1 percent, or one home in fourteen.
Three tiers, so you can pick the one you trust:
- 1,822 units, or 5.7 percent. Every unit with a published count behind it.
- 1,967 units, or 6.1 percent. Adds three buildings that disclosed a set-aside percentage but not a unit count.
- 2,300 units, or 7.1 percent. Adds seven buildings that published no count at all, held at Reston’s 12 percent workforce floor.
The denominator comes from the American Community Survey, which puts the Reston census designated place at 32,204 housing units in its 2024 one-year estimate, with a margin of error of 2,467. One-year estimates are the least precise vintage the Census Bureau publishes, so treat that figure as a range rather than a count. Run the same 2,300 units against a denominator of 30,000 and the share climbs to 7.7 percent.
Most of it predates the transit-era construction wave
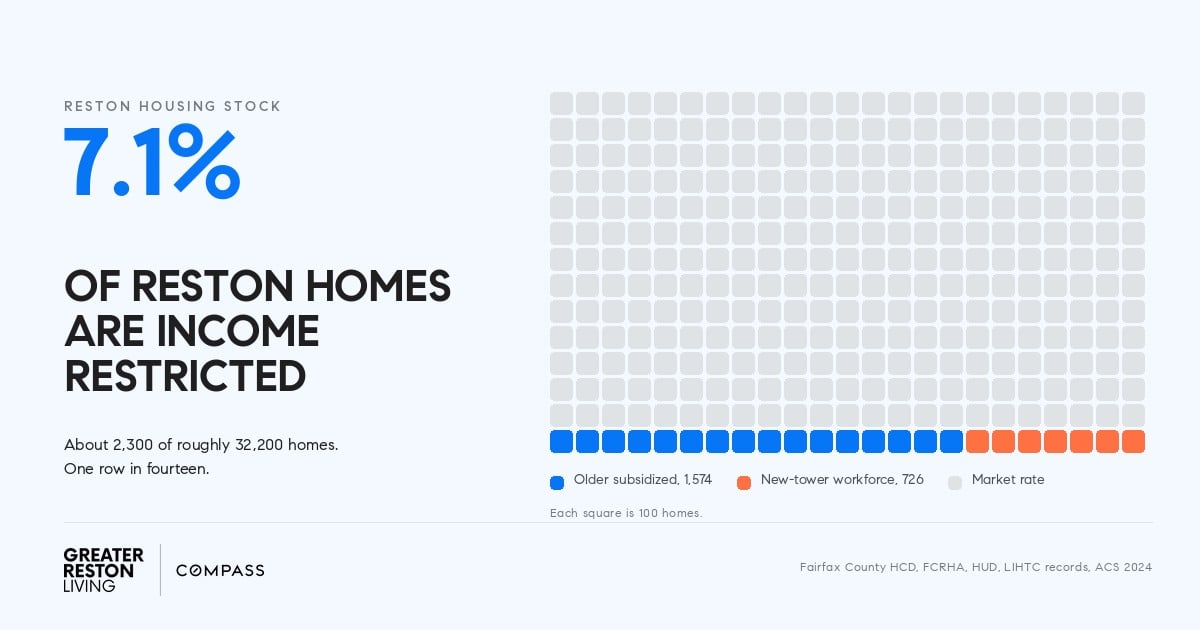
Fourteen older properties carry 1,574 units, about 68 percent of the total. This is the housing that Bob Simon’s mixed-income idea produced, plus what the county and its nonprofit partners assembled afterward.
| Property | Program | Units |
|---|---|---|
| Stonegate Village | Tax credit and project-based Section 8 | 240 |
| Lake Anne House | Tax credit, bonds, 122 vouchers, seniors | 240 |
| Hunters Woods Fellowship House | HUD subsidized, seniors 62 and older | 224 |
| Reston Glade | Income restricted, roughly 50 percent AMI | 200 |
| Cedar Ridge | Tax credit and project-based Section 8 | 194 |
| Crescent Apartments | Fairfax County Rental Program | 181 |
| Island Walk | Tax credit and Section 8 cooperative | 102 |
| The Green | RAD project-based vouchers | 50 |
| Apartments at North Point | Tax credit, Cornerstones-owned | 48 |
| Reston Town Center scattered units | RAD project-based vouchers | 30 |
| West Glade | Tax credit and county rental program | 24 |
| Parc Reston | Fairfax County Rental Program | 23 |
| Shadowood | RAD project-based vouchers | 16 |
| Fox Mill | Fairfax County Rental Program | 2 |
Three of those deserve a note.
Fellowship Square runs both Lake Anne House and Hunters Woods Fellowship House, which together hold 464 senior apartments. The Hunters Woods building on Colts Neck Road opened in 1979 and rarely appears in coverage of Reston affordable housing, which tends to follow the Lake Anne redevelopment instead.
Lake Anne House replaced the 1970s Lake Anne Fellowship House one for one, 240 units for 240 units, and HUD wrote up the project as a case study. Market-rate townhomes went on the east half of the old parcel. The redevelopment held affordability flat on that site rather than adding to it, and it is the reason a 2022 building sits in a table of older stock.
Reston Glade on Laurel Glade Court is the one almost every tally misses, our own first pass included. The 1976 community carries income restrictions with a four-person ceiling of $81,950, right at 50 percent of area median income. It appears in no county affordable housing list we could find. Two hundred units is enough to move the headline percentage by six tenths of a point on its own.
The new towers hold less than the skyline suggests
Fifteen buildings delivered since roughly 2013 hold about 5,400 apartments between them. Reston’s comprehensive plan sets a sliding scale with a 12 percent workforce minimum, higher than the countywide rental floor, and the plan the Board adopted retained that Reston-specific scale.
Only five of the fifteen have published what they actually built.
| Building | Total units | Restricted | Basis |
|---|---|---|---|
| BLVD Reston Station | 448 | 88 | Published count |
| Arbor at Halley Rise | 480 | 72 | Published count |
| The Point at Reston | 306 | 37 | Published count |
| Faraday Park | 242 | 31 | Published count |
| Faraday Park East | 166 | 20 | Published count |
| Skymark | 508 | 81 | Our math on a 16 percent proffer |
| The Point at Rise | 385 | 46 | Our math on a published 12 percent |
| Hunters Woods at Trails Edge | 90 | 18 | Our math on a stated 20 percent |
| Signature at Reston Town Center | 508 | 61 | Estimated at the 12 percent floor |
| Exo | 457 | 55 | Estimated at the 12 percent floor |
| Aperture | 421 | 51 | Estimated at the 12 percent floor |
| Blvd Haley | 419 | 50 | Estimated at the 12 percent floor |
| The Avant at Reston Town Center | 359 | 43 | Estimated at the 12 percent floor |
| The Edmund | 353 | 42 | Estimated at the 12 percent floor |
| Russell at Reston Station | 260 | 31 | Estimated at the 12 percent floor |
That comes to about 726 restricted units, or 13.4 percent of those buildings.
The estimated rows sit at the bottom of a plausible range rather than the middle of one. BLVD Reston Station delivered 88 workforce units, close to 20 percent of the building, and the Reston Gateway rezoning proffered 322 workforce units across 2,010, or 16 percent. Six of the seven estimated buildings appear on the county’s affordable rental list with their AMI tiers disclosed but no unit counts attached. Signature at Reston Town Center and Skymark do not appear on that list at all, which makes their rows the softest numbers in the table.
Faraday Park is the cleanest published example, with 31 workforce units in the first tower and 20 in the second. Arbor at Halley Rise opened with 72 across the 70, 80, and 100 percent area median income tiers.
What workforce housing actually pays
The word workforce carries a picture that the income limits do not match. Fairfax County uses a 2025 area median income of $163,900 for a household of four, set by HUD. The workforce tiers run off that figure.
For a four-person household, 70 percent of area median income means a ceiling of $114,750. Eighty percent means $131,100. One hundred percent means $163,900. For a single person the same tiers land at $80,350, $91,750, and $114,750.
Those are teacher, nurse, county employee, and mid-career professional numbers. They sit well above the tiers carrying most of Reston’s older stock, where Stonegate Village and Cedar Ridge run tax credit and project-based Section 8 units mostly at 30, 50, and 60 percent of area median income, and Reston Glade sits at 50 percent. The county’s April 2026 needs assessment puts the countywide shortage at roughly 13,800 rental homes affordable below that 60 percent line.
So the 7 percent figure stacks two different kinds of housing into one number. About 1,574 units serve low-income and senior households. About 726 serve the workforce tiers. Treating the whole 7 percent as one population produces the wrong conclusion about what Reston has and what it lacks.
Affordable is a legal term, not a price
Every unit counted above carries a deed restriction or a subsidy contract tied to a stated share of area median income. A household qualifies, applies, and gets certified. The rent follows a schedule.
A much larger category of Reston housing does similar work with no legal protection behind it. The 1970s garden apartments off Glade Drive, the older condos in Hunters Woods and Southgate, the townhomes in the original clusters: those carry no restriction at all. They rent and sell below the new construction because they are older, smaller, and mostly original inside. Nothing preserves that. When one sells to an investor who renovates it, or when a cluster votes to sell, the price moves with the market.
Any percentage you see quoted, including ours, counts only the legal category.
Approved is not delivered
The gap between what gets entitled and what gets built explains a lot of the frustration at community meetings.
Reston Now reported in February 2020 that the county approved 10,045 residential units in Reston from early 2014 through June 2019, with just under 15 percent designated affordable. Over roughly the same span, private developers delivered 453 workforce rentals and 188 affordable dwelling units across Herndon and Reston together. The two figures cover different footprints, so they do not divide into a clean delivery rate, but the direction is clear enough.
Supervisor Walter Alcorn told a community meeting in April 2025 that Reston carries 11,000 approved but unbuilt residential units. At the 12 percent floor those would carry roughly 1,320 restricted homes, raising the current count by about 57 percent. At Reston Station’s demonstrated 20 percent it would be closer to 2,200, which nearly doubles it. Both figures assume the buildings get built, which turns on construction financing and lease-up rents as much as on entitlements.
The count is concentrated, which makes it fragile
Seven properties hold 1,381 of the 2,300 units. Stonegate Village, Lake Anne House, Hunters Woods Fellowship House, Reston Glade, Cedar Ridge, Crescent, and Island Walk carry 60 percent of the whole figure between them.
The Board authorized FCRHA in January 2025 to pursue a redevelopment of Crescent Apartments, with a solicitation expected in 2026 and a plan amendment pending. FCRHA has said it aims to double the number of income-restricted units on the site. If that lands, the percentage rises. If a tax credit deal falls through somewhere else, or a HUD contract lapses at one of the senior buildings, the percentage drops by most of a point on a single decision.
A number this concentrated moves in big steps rather than trends.
Where we drew the boundary
Reston has three different footprints, and picking a different one changes the answer.
The Census Bureau’s Reston census designated place is the one we used, because it is the only footprint with a published housing unit estimate. Reston Association membership covers a different area. Fairfax County’s Reston planning district is different again, and it is the boundary county staff use in rezoning reports.
A Reston affordability percentage that differs from ours may simply be drawing a different line. Ask which one before arguing about the number.
We counted rental and cooperative units only. We excluded shelter beds, including the 70 at the Embry Rucker shelter on Bowman Towne Drive, because a shelter bed is not a housing unit. We excluded group homes and scattered supportive housing because no public source itemizes them.
What we could not verify
Cornerstones advertises more than 100 affordable homes. The only Reston property we could name and count is the 48 units at North Point. The rest appear to be scattered condominiums and townhomes that no public source lists, so the true total runs somewhat above 2,300.
Hunters Woods at Trails Edge appears on the county’s workforce list, and its developer stated that 20 percent of independent living units would be offered as affordable. No document confirms the final count, so 18 is our arithmetic rather than a published figure.
Crescent Apartments appears as 181 units in the county rental program list and 180 in the FCRHA budget. We used 181. Cedar Ridge shows the same one-off discrepancy, at 194 and 198.
What this means if you are buying or selling here
For renters and buyers watching the new buildings. Workforce units at 70 to 100 percent of area median income exist in most of the towers at Reston Station, Halley Rise, and Town Center. Income limits and availability run through Fairfax County’s affordable rental list, and waitlists move building by building rather than through one central queue. The for-sale side runs through the county’s workforce dwelling unit homebuyer program, which is smaller and less publicized than the rental side.
For owners in the older clusters and condos. Your building is probably part of Reston’s unrestricted lower-cost stock even though nothing labels it that way. That shapes buyer pools, appraisal comps, and how a renovation prices out. It also means a well-executed update in an older Reston condo has comps that sit below where the finished unit belongs, which is a pricing conversation worth having before the work starts rather than after.
For anyone reading development coverage. When a rezoning promises a percentage, check whether the figure describes the whole development or one building. Reston Gateway’s 16 percent covers 2,010 units across several blocks, not each tower individually. The math at the block level and the math at the project level produce different numbers, and headlines rarely say which one they are using.
The number, one more time
About 2,300 of Reston’s roughly 32,200 homes carry a legal affordability restriction. That is 7.1 percent, one in fourteen, with a defensible range of 5.7 to 7.1 percent depending on how many unpublished buildings you are willing to estimate, and a top end near 7.7 percent if the true housing stock sits closer to 30,000.
Roughly two thirds of it predates the transit-era towers. The new buildings add real restricted units at a 12 to 20 percent clip, and they add market-rate units alongside them at a much larger volume, which is why a decade of cranes has not produced the shift in the percentage that the skyline implies.
We track Reston development filings week by week and can pull the affordable component out of any specific project. If you are weighing a purchase, a sale, or a move within Reston, reach out and we will walk through what the numbers mean for your block rather than for the region.